Key takeaways
- Revenue cycle KPIs show how efficiently your practice turns visits into payments, and where revenue leaks.
- Track a balanced set across the front end, mid-cycle and back end of the revenue cycle.
- Trends matter more than single numbers: review monthly and compare with prior periods.
- Read KPIs together to diagnose causes, then break them down by payer, provider and location.
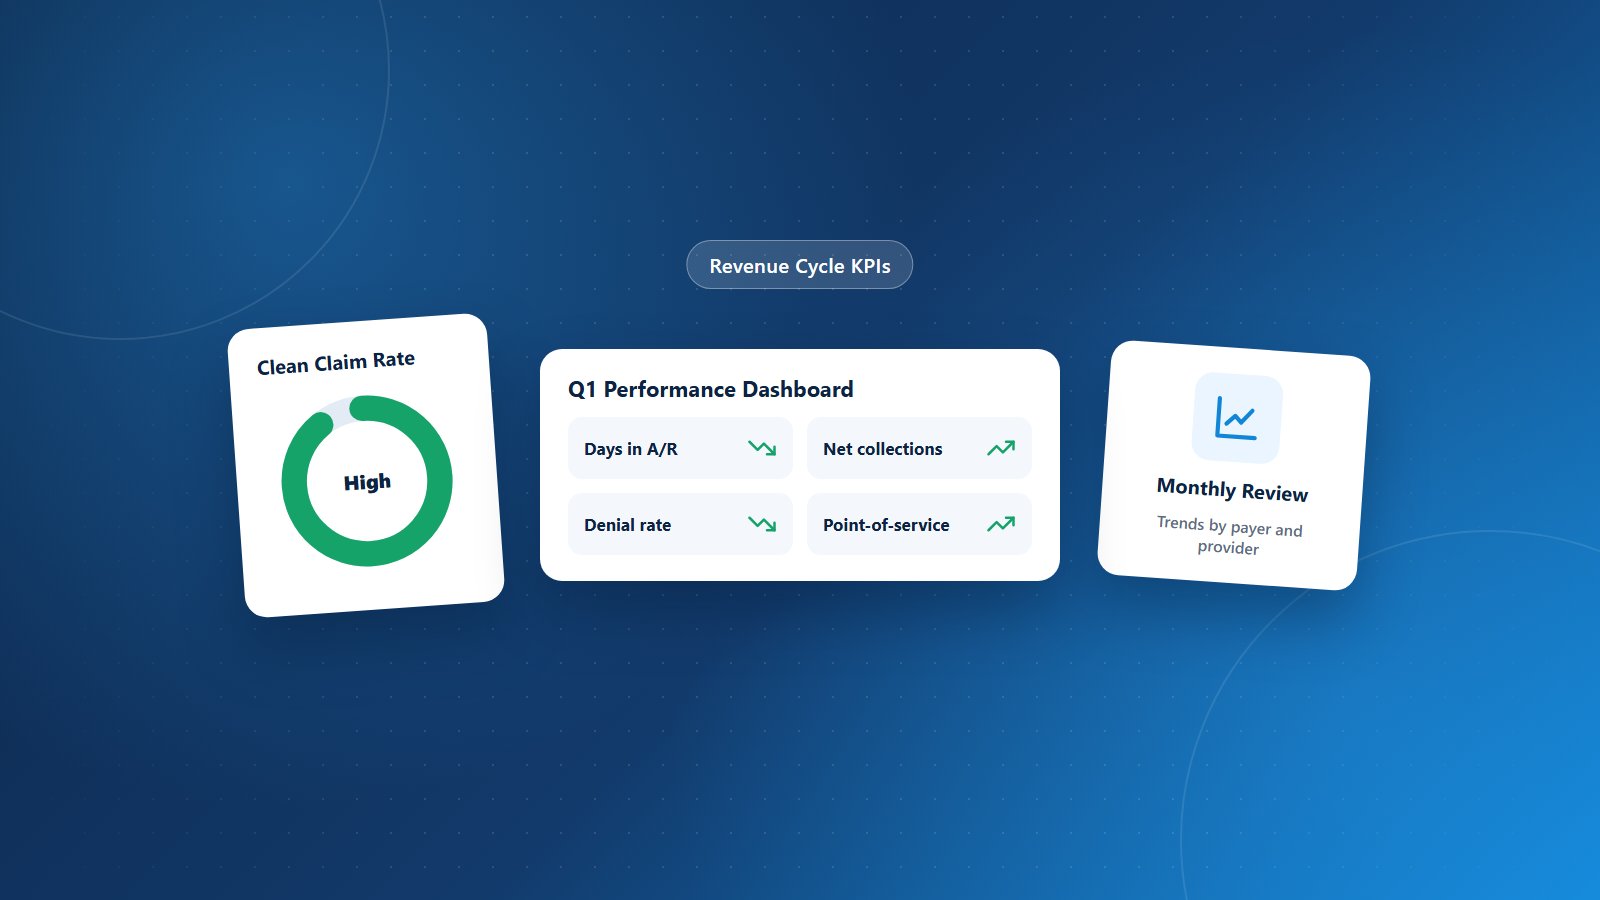
- A simple monthly dashboard and review meeting turn numbers into action.
You can’t improve what you don’t measure. Many practices know their total collections each month but have little insight into why collections rise or fall. Revenue cycle key performance indicators (KPIs) reveal how efficiently your practice turns patient visits into payments and exactly where revenue is leaking.
This guide explains the KPIs every practice should track, how to calculate each one, what they tell you individually and together, and how to build a simple dashboard and review routine that drives improvement.
The Revenue Cycle in Three Stages
It helps to group KPIs by where they sit in the revenue cycle:
- Front end: scheduling, registration, eligibility, authorization and time-of-service collections.
- Mid-cycle: documentation, coding, charge entry and claim creation.
- Back end: claim submission, payment posting, denials, appeals, A/R follow-up and patient collections.
A problem in one stage often shows up in another stage’s metrics, which is why reading KPIs together matters.
KPI Summary
| KPI | Stage | What it tells you |
|---|---|---|
| Point-of-service collection rate | Front end | How well patient responsibility is collected at visits |
| Eligibility-related denial rate | Front end | Quality of registration and verification |
| Charge lag | Mid-cycle | How quickly services become claims |
| Clean claim rate | Mid-cycle | Claim quality on first submission |
| Denial rate | Back end | How often payers refuse claims |
| First-pass resolution rate | Back end | Claims paid on first submission |
| Days in A/R | Back end | Average time to get paid |
| A/R over 90 days | Back end | Revenue at risk of loss |
| Net collection rate | Overall | How much collectible revenue is collected |
| Bad debt rate | Overall | Patient balances written off |
| Cost to collect | Overall | Efficiency of the billing operation |
Front-End KPIs
Point-of-service collection rate
What it measures: The percentage of patient responsibility collected at the time of the visit.
How to calculate: Patient payments collected at the visit divided by patient responsibility known at the visit.
Why it matters: Balances collected at check-in or check-out are far more likely to be paid than those billed later. Read our time of service collection tips.
Eligibility-related denial rate
What it measures: The share of denials caused by coverage, registration or eligibility issues.
Why it matters: These denials are almost entirely preventable. A rising rate points to front-desk process gaps.
Mid-Cycle KPIs
Charge lag
What it measures: The time between the date of service and the date charges are entered.
Why it matters: Delays in documentation or charge entry slow down the entire cycle and push claims toward timely filing limits.
Clean claim rate
What it measures: The percentage of claims accepted and processed on first submission without edits, rejections or rework.
How to calculate: Claims accepted on first submission divided by total claims submitted.
Why it matters: High clean claim rates mean faster payment and lower administrative cost. Learn how to raise your clean claim rate.
Back-End KPIs
Denial rate
What it measures: The percentage of claims denied by payers.
Why it matters: Every denial costs time and money to rework, and some are never recovered. Track denials by reason, payer and provider. See our guide to denial prevention and management.
First-pass resolution rate
What it measures: The percentage of claims paid on the first submission.
Why it matters: It reflects the overall quality of your billing process from registration to coding.
Days in accounts receivable
What it measures: The average number of days it takes to collect payment after a service is provided.
How to calculate: Total accounts receivable divided by average daily charges (total charges over a period divided by the number of days in that period).
Why it matters: Rising days in A/R signal slow claim submission, payer delays or weak follow-up. Lower and stable is the goal.
Percentage of A/R over 90 days
What it measures: The share of outstanding receivables older than 90 days.
Why it matters: The older a claim gets, the less likely it is to be paid. Read what your A/R aging report is telling you.
Overall KPIs
Net collection rate
What it measures: The percentage of collectible revenue the practice actually collects, after contractual adjustments.
How to calculate: Payments divided by (charges minus contractual adjustments) over the same period.
Why it matters: This is one of the clearest indicators of billing effectiveness. A strong net collection rate means you’re collecting nearly everything you’re owed.
Bad debt rate
What it measures: The share of patient balances written off as uncollectible.
Why it matters: Rising bad debt suggests weaknesses in financial counseling, estimates or patient follow-up.
Cost to collect
What it measures: Total billing and collection costs divided by total collections.
Why it matters: A high cost to collect means too much rework or manual effort. Read about overhead and cost to collect.
How KPIs Work Together
| What you see | Likely cause |
|---|---|
| Days in A/R rising, clean claim rate steady | Follow-up or payer processing delays |
| Denial rate rising, eligibility denials leading | Front-desk or coverage verification gaps |
| Collections flat, visits up | Missed charges, undercoding or underpayments |
| A/R over 90 days growing for one payer | Credentialing, contract or payer-specific issue |
| Point-of-service collections falling, bad debt rising | Weak financial conversations at check-in |
| Charge lag increasing | Documentation or charge entry backlog |
Building a Simple KPI Dashboard
- Choose five to seven KPIs that matter most for your practice.
- Pull data from your practice management system on the same day each month.
- Show the current month, prior month and same month last year.
- Break key metrics down by payer, provider and location.
- Highlight any metric that moved significantly.
- Assign follow-up actions in your monthly review meeting.
Running a Monthly Revenue Review
- 15 minutes: review the dashboard and flag changes.
- 15 minutes: review top denial reasons and aged A/R by payer.
- 15 minutes: agree on actions, owners and deadlines.
- Next month: start by checking whether last month’s actions worked.
Turning KPIs Into Action
- Set realistic targets and assign ownership for each metric.
- Investigate sudden changes immediately rather than waiting for quarter-end.
- Use a billing audit when metrics decline without an obvious cause.
- Review performance at mid-year with our mid-year RCM scorecard.
Related Guides
- Accounts Receivable Aging: What Your A/R Report Is Telling You
- How to Raise Your Clean Claim Rate
- Denial Prevention vs. Denial Management
- Payment Posting Accuracy: Why ERA Reconciliation Matters
- Underpayment Detection: Are Payers Paying Your Contracted Rates?
- Timely Filing Limits: A Year-End A/R Rescue Plan
- Deductible Season: How to Improve Patient Collections
- How to Protect Your Practice Margins When Reimbursements Tighten
Frequently Asked Questions
Which KPI matters most?
Net collection rate is one of the best overall indicators, but read it alongside days in A/R and denial rate to understand why it moves.
How often should we review KPIs?
Monthly for most practices, with weekly monitoring of denials and A/R by the billing team.
Should we compare ourselves with other practices?
Benchmarks can help, but they vary by specialty, payer mix and size. Your own trend over time is often more meaningful.
What if our system can’t produce these reports?
Most practice management systems can, but reports may need to be configured. A billing partner can also provide KPI reporting.
Get Clear KPI Reporting From PRCM
Physicians Revenue Cycle Management provides user- and admin-friendly dashboards with performance indicators, practice revenue monitors and analytical reporting. Our revenue cycle management team doesn’t just report the numbers; we work to improve them.
Want a clear view of your practice’s financial health? Let’s connect.