Key takeaways
- An A/R aging report groups unpaid balances by age and shows where revenue is stuck.
- The older a claim gets, the less likely it is to be paid, so the 90+ day bucket deserves the most attention.
- Patterns by payer, provider or claim type point to specific, fixable problems.
- Review the report monthly, work it weekly and fix the root causes behind aging claims.
Your accounts receivable (A/R) aging report is one of the most valuable tools in your practice, and one of the most underused. It shows exactly how much money is owed to your practice, who owes it and how long it’s been outstanding. Read correctly, it reveals problems in your revenue cycle long before they show up in your bank account.
This guide explains how to read your A/R aging report, what different patterns mean and how to act on them.
What Is an A/R Aging Report?
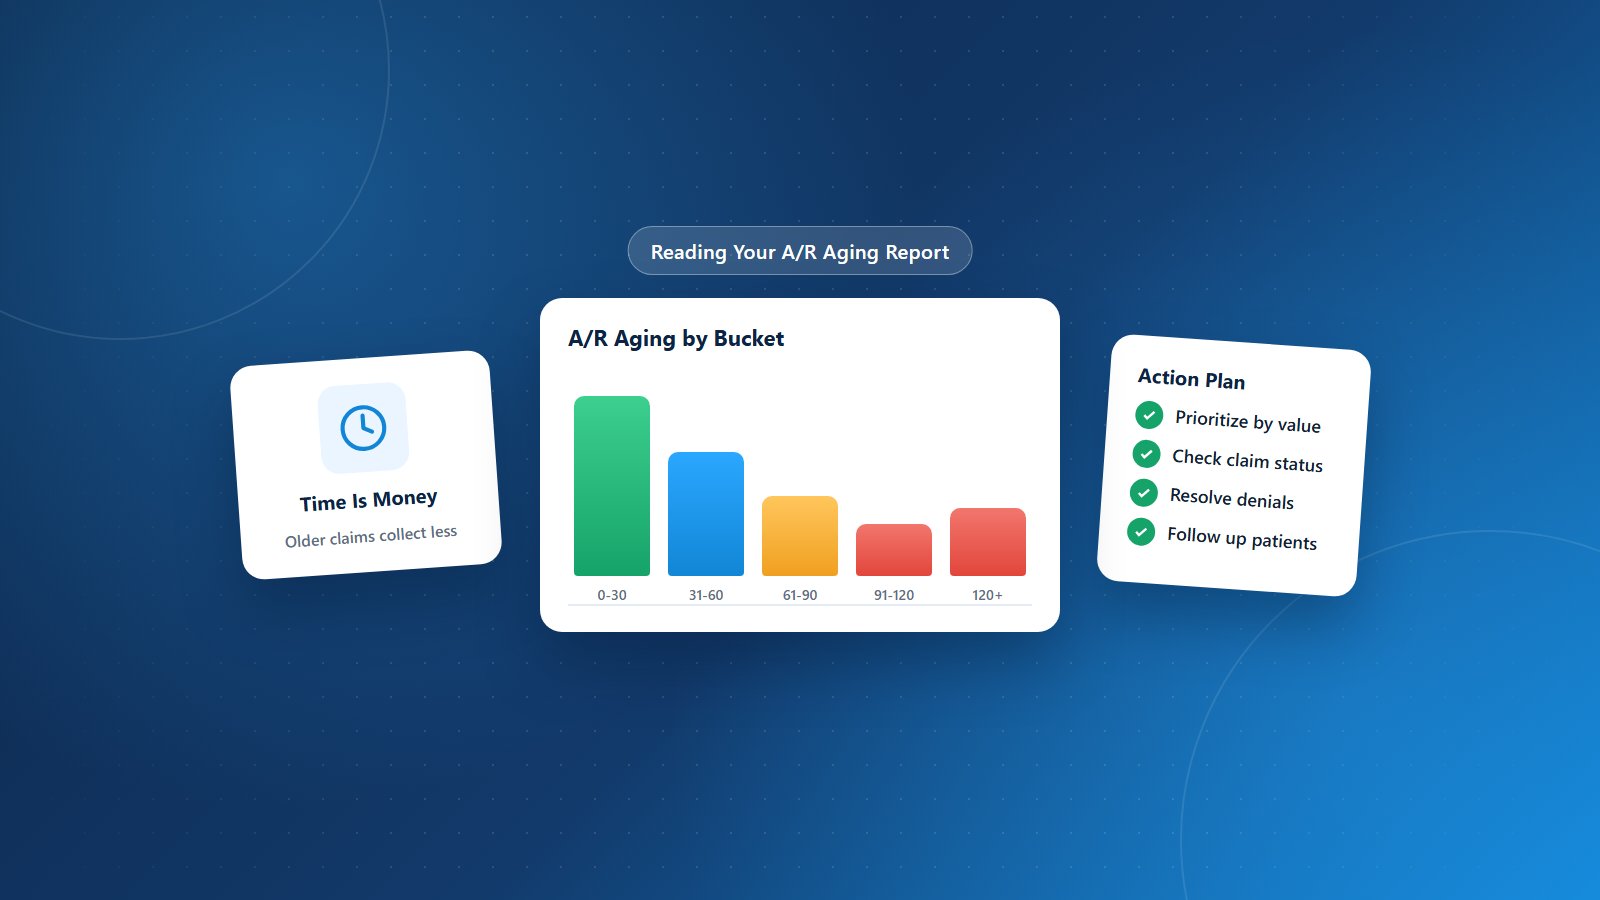
An A/R aging report groups unpaid balances by how long they’ve been outstanding, usually in buckets such as:
- 0–30 days
- 31–60 days
- 61–90 days
- 91–120 days
- 120+ days
Most practice management systems let you run the report by payer, provider, location and whether the balance is insurance or patient responsibility. Aging can be calculated from the date of service or the date the claim was submitted, so make sure you know which your system uses.
Why Aging Matters
The longer a claim stays unpaid, the less likely it is to be collected. Older claims face timely filing and appeal deadlines, missing information becomes harder to obtain and patients are less likely to pay balances from services months ago. A healthy practice keeps most of its A/R in the younger buckets.
How to Read the Buckets
| Bucket | What it usually means | Priority |
|---|---|---|
| 0–30 days | Normal processing time for recent claims | Monitor |
| 31–60 days | Claims that should be paid soon; some may be stalled | Check status |
| 61–90 days | Likely denials, missing information or lost claims | Work actively |
| 91–120 days | At risk; follow-up gaps or unresolved denials | High |
| 120+ days | Serious risk of write-off; deadlines may be near | Urgent |
What Your A/R Report Is Telling You
A growing 0–30 bucket
This can be healthy: it often reflects growing patient volume. But if it rises while collections don’t, claims may be delayed in submission or payer processing.
A heavy 31–60 or 61–90 bucket
Claims that should have been paid are stalling. Common causes include denials not being worked, payer requests for information and clearinghouse rejections that were never corrected.
A large 90+ bucket
This is the biggest warning sign. Balances over 90 days indicate follow-up gaps, unresolved denials or uncollected patient balances. Revenue here is at serious risk of write-off.
One payer dominating aged A/R
If a single payer accounts for a disproportionate share of older claims, look for a credentialing issue, a policy change, a contract problem or a systemic billing error with that payer.
One provider dominating aged A/R
Provider-specific aging can point to documentation delays, enrollment problems or coding issues for that provider’s services.
Rising patient A/R
Growing patient balances suggest weaknesses in collecting at time of service, cost estimates or statement processes.
Example: Reading a Real Pattern
Imagine your aging report shows that most of your 90+ day balances belong to one commercial payer, and nearly all of them are for a newly hired provider. That pattern strongly suggests the provider’s enrollment with that payer wasn’t complete on their start date. The fix isn’t just appealing claims one by one; it’s confirming the provider’s effective date, correcting enrollment and then reprocessing affected claims.
How to Act on Your A/R Report
- Prioritize by value and age. Work high-dollar claims and those nearing filing deadlines first.
- Check claim status. Confirm whether the payer received the claim and what’s holding it up.
- Resolve denials. Correct and resubmit or appeal with complete documentation.
- Escalate stuck claims. Use provider representatives for payer-wide problems.
- Follow up with patients. Send clear statements, make reminder calls and offer payment plans.
- Fix root causes. Address the registration, coding, credentialing or authorization issues that created the problem.
Key Metrics to Track Alongside Aging
- Days in A/R: How long it takes, on average, to get paid.
- Percentage of A/R over 90 days: A clear measure of follow-up effectiveness.
- Net collection rate: How much of what you’re owed is actually collected.
- Denial rate: How often claims are denied, by reason.
Learn more in our guide to revenue cycle KPIs every practice should track.
Make A/R Review a Routine
- Weekly: Work claims in the 31+ day buckets by priority.
- Monthly: Review aging trends by payer and provider with leadership.
- Quarterly: Look for systemic issues and update workflows.
Frequently Asked Questions
What percentage of A/R should be over 90 days?
As little as possible. Track your own trend and investigate any steady increase, especially by payer.
When should we write off old balances?
Only after appropriate follow-up and according to your financial and compliance policies. Writing off too early leaves money behind; writing off too late distorts your reports.
Should patient A/R be tracked separately?
Yes. Insurance and patient balances have different causes and solutions, so review them separately.
Let PRCM Work Your A/R
Physicians Revenue Cycle Management’s A/R management includes automated and rigorous follow-ups, denial management, payment appeals and patient balance support. Our revenue cycle management team turns aging claims into collected revenue. See also the most common claim denial reasons.
Is your 90+ day bucket growing? Let’s connect.